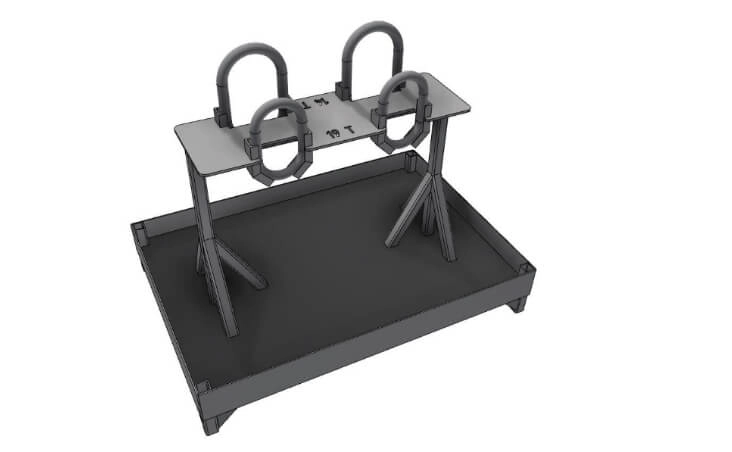
DEUFOL mobile hoist chain storage rack
Do you use heavy hoist chains in your company? With the DEUFOL hoist chain storage rack you work safely, smoothly and efficiently!
Does your company use hoist chains safely and efficiently?
In many companies hoist chains are often lying around chaotically on the work floor. You may already have experienced the following:
- Loss of time when looking for and collecting lifting equipment.
- Hoist chains lying on the shop floor makes changing not ergonomic and less safe: people can injure themselves when the chains are being hoisted.
- The hoisting material is lying disorderly on the work floor and can be damaged or can damage other things when the chains are being hoisted.
- When the inspection company visits for the periodic inspection of the lifting and hoisting equipment, the hoisting equipment that cannot be found will not be inspected, which can have major consequences in the event of a breakage and accident.

We have the solution for you! With the DEUFOL mobile hoist chain storage rack, you can always work safely and smoothly!
Collect your hoist chains in the DEUFOL hoist chain
storage rack, tailor-made for you!
The hoist chains return to their intended place after use. This way the chains are neatly arranged and easy to find again the next time they are used. So no more hoist chains lying around on the work floor!
The most important advantages of the DEUFOL hoist chain storage rack:
- Saves time: less searching and easier changing of lifting chains.
- Safer: safely stored chains ensure ergonomic and safe use.
- Mobile: do you need the chains at different places in the company? The DEUFOL box can be moved by forklift or pallet truck.


The main features of the DEUFOL hoist chain storage rack:
- Steel construction
- Designed and produced in Belgium and tailored for your lifting chains.
- Specifically for heavier lifting chains that are difficult to lift.
- 100% in-house produced and painted, with primer and finishing paint in colour of your choice.
- Can be moved with a forklift truck or a pallet truck.
Watch in this video how our colleague works with the mobile lifting chain box:

Mit dem Laden des Videos akzeptieren Sie die Datenschutzerklärung von YouTube.
Mehr erfahren
Work more safely and efficiently with your lifting chains! Use the DEUFOL mobile lifting chain box!
Would you like more information about the DEUFOL mobile lifting chain box?
Call us: +32 (0)11 60 64 00
Mail us: belgium@deufol.com

