DEUFOL along your
supply chain

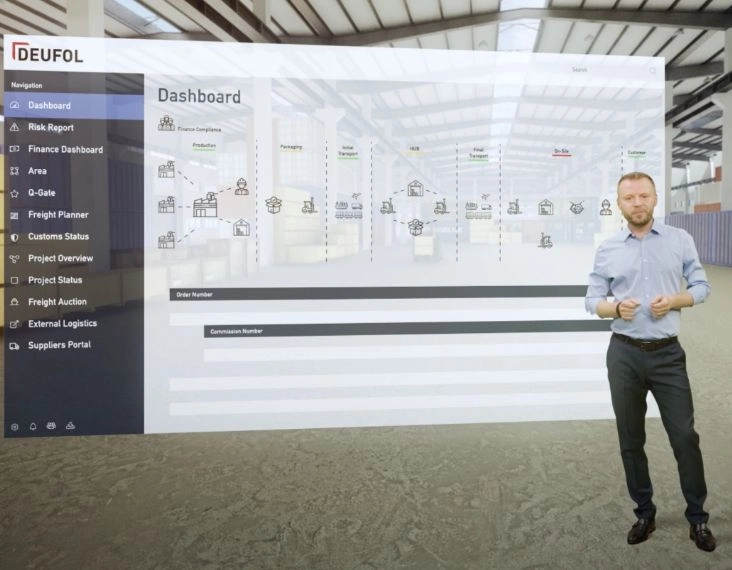
Discover now in our new DEUFOL video how we can support you with our digital, efficient, and sustainable end-2-end solutions around your supply chain.

YouTube

Mit dem Laden des Videos akzeptieren Sie die Datenschutzerklärung von YouTube.
Mehr erfahren

Video laden

End-2-End Transparency: Efficiency and Sustainability throughout your supply chain

The primary goal of our End-2-End approach is to make your supply chain more efficient and at the same time more sustainable. For this purpose, we offer you a wide range of precisely tailored solutions and services that not only support one segment of your supply chain, but they can also in particular optimize your entire logistic processes.

As an example, our supply chain management software D-SCS ensures greater efficiency, sustainability, and data security in your supply chain. This way, you can digitally manage all material, data, and financial flows, while easily including external tools as well as additional zones and locations. However, there are numerous other DEUFOL End-2-End solutions!

Benefit from our custom-fit packaging solutions for your industrial goods

Through our many years of experience in the field of custom packaging, we have become one of the market leaders in the area of packaging and shipping of industrial goods. We provide packaging solutions for all types of products, including hazardous or heavy goods.

For each product, we offer the appropriate industrial packaging and also support you along the most varied transport routes. Regardless of whether it is transported by air or sea freight, by rail or by truck.

Discover the advantages of our DEUFOL Seaport HUBs

We analyse, consolidate, optimise and digitalise your supply chain within the framework of a DEUFOL HUB that is suitable and individually tailored for you. Here you will benefit from holistic, professional packaging, transport, and logistics services tailored to your needs. At the same time, your DEUFOL HUB forms the interface within your entire supply chain. In this way, you have a transparent overview of the location, status, and deadlines of your goods as well as an optimised sustainable flow of goods in your supply chain.

Optimise your entire supply chain with our supply chain consulting

The more complexity there is in your supply chain, the more likely it is that there will be delays, additional work, and unnecessary costs. With DEUFOL, you have a partner who knows these challenges inside out. We have first-class expert knowledge in the field of Industry 4.0 and supply chain, which makes us one of the leading consultants in this dynamic market.

Contact us now for a personal consultation

Would you now also like to benefit from our end-2-end services and solutions for your supply chain? Then simply contact us and let one of our contact persons advise you personally! Together with you, we will clarify your individual needs, find the right answers to your questions and develop a suitable concept for you!

Earnings situation in (€ thousand)

1. Hy 2024 2. Hy 2024 1. Hy 2025 2. Hy 2025 1. Hy 2026
Total turnover 154.684 154.459 154.933 156.339 158.911
EBITDA 16.976 17.853 17.738 19.972 17.836
EBIT 6.142 6.891 5.841 6.614 3.486
EBT 3.274 4.105 2.747 3.207 491
Results for the period 2.257 2.151 1.492 1.690 -619
Earnings per share (€) 0,2271) 0,233 0,158 0,168 -0,082

1) Adjustment of earnings per share for the first half of 2024 in accordance with IAS 33 (due to the reverse split); see the 2024 Annual Report.

The key figures included in the report are rounded for commercial purposes. In individual cases, rounding may mean that the values in the report do not add up exactly to the specified total and that the percentages do not correspond exactly to the values shown.

Earnings situation in (€ thousand)

2021 2022 2023 2024 2025
Total turnover 243.049 271.580 294.004 309.142 311.272
EBITDA 27.475 34.033 46.116 34.829 37.710
EBIT 6.340 13.223 16.642 13.032 12.454
EBT 2.906 10.414 11.341 7.379 5.954
Results for the period 1.933 7.009 7.196 4.408 3.182
Earnings per share (€) 0,030 0,151 0,1531) 0,460 0,326

1) Without retroactive adjustment of earnings per share for the year 2023. For adjusted figures in accordance with IAS 33, please refer to the 2024 Annual Report.

The key figures included in the report are rounded for commercial purposes. In individual cases, rounding may mean that the values in the report do not add up exactly to the specified total and that the percentages do not correspond exactly to the values shown.